Understanding how to calculate production capacity of paper cup machines is essential for realistic planning. A machine may advertise 100 cups per minute, yet factory output rarely matches that figure. Operators must examine speed, cup size, paper quality, heating stability, and actual running time. Small details matter. Even a ten-minute adjustment delay can reduce a full shift’s output.
Ethan Wu, a paper cup machinery consultant with more than 18 years of production experience, explains, “Rated speed is only the beginning; usable capacity depends on every minute the machine actually runs.” This practical observation supports a simple approach: calculate theoretical capacity first, then subtract planned downtime, material waste, quality checks, and changeover losses. For example, a machine running at 80 cups per minute for eight hours has a theoretical output of 38,400 cups. If its effective operating rate is 85%, the expected production falls to 32,640 cups.
That figure is useful, but it is not perfect. Actual results can change with operator skill, room temperature, sealing pressure, and paper moisture. I have seen production plans fail because they trusted catalog speed too much. A better estimate records hourly output over several shifts. Compare the numbers. Question unusual results. The seven tips in this guide explain how to measure capacity more accurately, choose the right calculation method, and avoid confusing maximum speed with dependable daily production. Reliable planning begins with honest data, not impressive machine specifications.
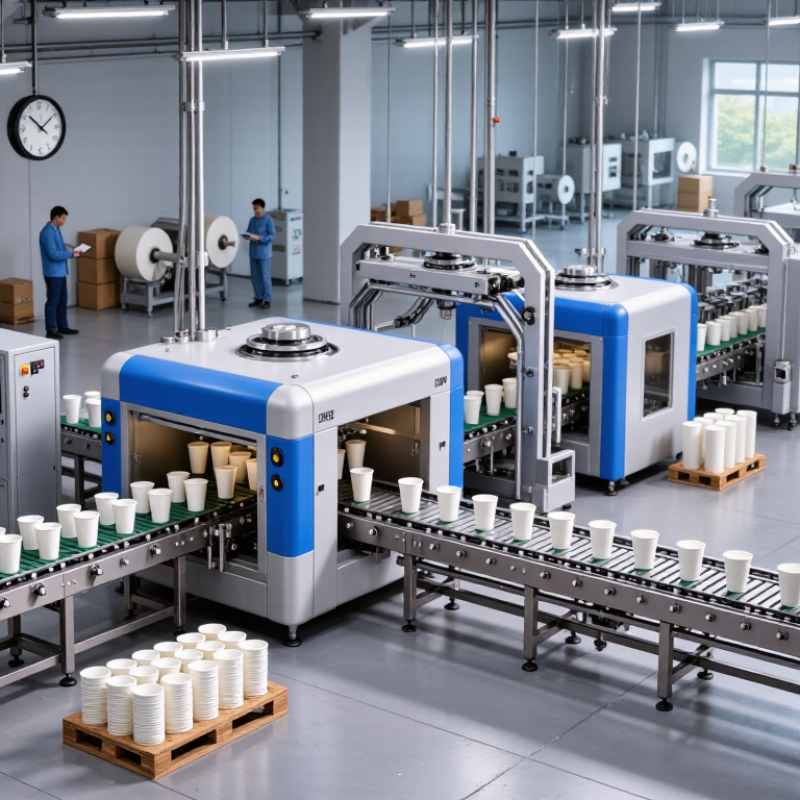
A machine’s rated speed is only a starting point. Check its output for your exact cup size, paper thickness, and forming design. Larger cups usually require slower forming cycles. Measure real output.
Count the forming cavities carefully. A four-cavity system may produce more cups than a single-cavity system, but only when each cavity runs consistently. Use this basic formula: hourly capacity equals cycle speed multiplied by cavities, then adjusted for operating time.
Downtime changes the answer. Record stops caused by paper loading, mold cleaning, sealing adjustments, and routine maintenance. A practical utilization rate often sits below the ideal figure. Keep records.
Material quality also matters. Uneven paper moisture can cause curling, weak seals, or rejected cups. Track the rejection rate during a full shift, not during a short demonstration. A five percent defect rate can remove hundreds of saleable cups each day.
Cup size, operator skill, heating stability, and inspection speed deserve attention. Include planned breaks and changeover time in your calculation. Capacity is not just machine speed.
Run a timed production test with normal materials. Compare the result across several shifts. One test is not enough.
Review the estimate monthly. Production conditions change, and small losses accumulate quietly. A reliable capacity figure should support staffing, material purchasing, and delivery planning, while leaving room for unexpected problems.
7 Tips to Calculate Paper Cup Machine Production Capacity
Measure Output Using Speed, Cavity Count, and Operating Time
Paper cup capacity starts with the machine’s actual forming speed. Check whether the stated speed means cycles per minute or finished cups per minute. If it means cycles, multiply cycles by the number of cavities. A machine running at 35 cycles per minute with 8 cavities can theoretically produce 280 cups per minute. Do not multiply twice. That mistake is surprisingly common.
Convert operating time into minutes for consistent measurement. Eight hours equals 480 minutes, but scheduled time is not productive time. Subtract setup, material changes, cleaning, maintenance, and short stoppages. Then use this basic formula: theoretical output equals speed multiplied by cavity count and operating minutes. Record the result beside the shift date. Small details matter.
Real production needs an efficiency adjustment. Include startup losses, paper jams, sealing problems, and rejected cups. If the machine reaches 280 cups per minute but operates at 82 percent efficiency, expected output is about 229 cups per minute. Multiply that figure by productive minutes. A sample run is essential. I have seen clean calculations fail during humid shifts. Measure several hours, count acceptable cups, and compare them with the estimate. The result may be lower, but it is more trustworthy. Keep both figures: theoretical capacity for planning and verified capacity for purchasing and delivery decisions.
A paper cup machine’s rated speed is only a starting point. To estimate real production capacity, multiply cups per minute by planned operating minutes. Then adjust the result for material waste, downtime, and production efficiency.
Track paper waste from trimming, printing defects, incorrect sealing, and rejected cups. If a machine forms 120 cups per minute, but material waste reaches 6%, usable output falls noticeably. Keep a sample log for each shift. Measure the actual paper roll weight and compare it with the finished cup count. Small losses become significant across a full month.
Downtime needs careful attention. Record time spent changing rolls, cleaning heaters, adjusting molds, and clearing jams. A forty-minute delay during an eight-hour shift reduces available production time by more than eight percent. Efficiency also changes with cup size, paper thickness, operator experience, and inspection standards. My early estimates were too optimistic because I used the machine’s maximum speed. That mistake looked harmless on paper. It was not. Use this practical formula: capacity equals rated output × available time × efficiency × usable material rate. Review the factors weekly, because one stable shift does not prove stable performance. Test difficult sizes separately. They often expose hidden losses.
This planning example uses a rated output of 120 cups per minute and an 8-hour shift. Capacity is adjusted successively for 10% material waste, 15% downtime, and 10% production efficiency loss, resulting in an estimated effective output of approximately 39,658 cups per shift.
A paper cup machine’s theoretical capacity looks simple: rated speed multiplied by running hours. In practice, this figure is only a starting point. Check the cup size, machine cycle, forming speed, and working time before trusting the calculation. A machine rated at 100 cups per minute may theoretically produce 48,000 cups in eight hours. That number assumes continuous operation.
Real production is less perfect. Allow time for material loading, cup-size changes, lubrication, inspection, and minor adjustments. Short stops matter. A five-minute interruption repeated six times removes thirty minutes from the shift. Record these stops rather than estimating them from memory. Production logs, counter readings, and rejected-cup quantities provide stronger evidence.
I once calculated capacity from machine speed alone. That assumption was wrong. Actual output also depends on paper quality, printing accuracy, sealing temperature, operator response, and maintenance condition. Measure good cups, not total formed cups. For example, 42,000 formed cups may become 40,950 saleable cups after defects and testing. That difference changes delivery planning.
Compare results across several normal production days. Separate planned downtime from unexpected stoppages. Calculate efficiency by dividing actual good output by theoretical output, then multiply by 100. Keep the result realistic. A stable 82% efficiency may be more useful than an ambitious figure that the factory rarely reaches. Review the calculation when products, materials, or working shifts change. Production data can reveal problems, but it cannot explain every problem by itself.
Use Capacity Results to Plan Orders, Labor, and Equipment Needs
A useful capacity figure starts with real machine data, not only the rated speed. Record cups per minute, operating hours, setup time, paper changes, and stoppages. Measure actual output during at least three shifts. Include rejected cups, because saleable production matters most. A practical calculation is: net cups per hour equals gross output minus downtime and rejects. The first estimate is rarely perfect.
Use the result to match orders with available shifts. For example, 18,000 saleable cups per hour may support 126,000 cups during a seven-hour production day. Keep a safety margin. A 10% to 15% buffer can absorb minor jams, cleaning, and material delays. Do not promise every available minute. One shift may look excellent by accident.
Capacity data also guides labor planning. Assign operators for feeding, quality checks, packing, and changeovers. If one worker covers too many tasks, output can fall quietly. Use production records to decide whether another shift or trained operator is needed. The same figures support equipment decisions. Repeated overtime may justify another machine, spare forming tools, or a faster packing station. A spreadsheet can still mislead. Recheck capacity after changing cup size, paper weight, molds, or operator routines.
Multiply machine cycles per minute by cavity count and productive operating minutes. For example, 35 cycles, 8 cavities, and 480 minutes equal 134,400 cups. Do not multiply the cavity count twice. That mistake happens often.
Cycles describe forming actions, while cups describe finished units. If one cycle produces eight cups, 35 cycles create 280 cups per minute. Check the machine specification carefully. Wording can mislead.
Convert working hours into minutes. Eight hours equals 480 minutes. Subtract setup, paper changes, cleaning, maintenance, and stoppages. Scheduled time is not productive time.
Actual production includes startup losses, paper jams, sealing issues, and rejected cups. An efficiency rate adjusts the ideal number. At 82% efficiency, 280 cups per minute becomes about 229 acceptable cups.
Count saleable cups for delivery planning. For example, 42,000 formed cups may become 40,950 acceptable cups. Defects matter. They quietly reduce capacity.
Measure several normal production hours. Record machine counters, good cups, rejected cups, and stoppages. Compare the measured result with the theoretical calculation. The lower number may be more trustworthy.
Record the shift date, cup size, running minutes, output, rejects, and downtime. Separate planned downtime from unexpected stops. Memory is weak. Written records are better.
Use verified output to match orders with shifts and staffing. Plan operators for feeding, inspection, packing, and changeovers. A 10% to 15% buffer can absorb minor delays. Overtime may suggest another machine or improved packing equipment.
Review it after changing cup size, paper weight, molds, materials, or operator routines. Humidity and paper quality can also affect performance. My first estimate was wrong. Rechecking is necessary.
How to calculate production capacity of paper cup machines depends on several practical factors, including machine speed, the number of forming cavities, cup size, operating hours, and production conditions. Start by estimating the theoretical output using the machine’s running speed, cavity count, and planned operating time. Then adjust this figure to reflect material waste, machine setup, maintenance, changeovers, and other sources of downtime. A realistic efficiency rate is essential because actual production rarely matches the maximum rated capacity.
Comparing theoretical capacity with recorded daily output helps identify performance gaps and improve planning. Reliable capacity results can support more accurate order scheduling, labor allocation, raw material purchasing, and equipment decisions. By reviewing production data regularly, manufacturers can determine whether current resources are sufficient, identify bottlenecks, and establish achievable targets. This approach provides a practical foundation for improving productivity while maintaining consistent quality and meeting delivery requirements.

Jinli Machinery